
Home › Design Assets › A Coronavirus Scale-Zoom Infographic, Level by Level
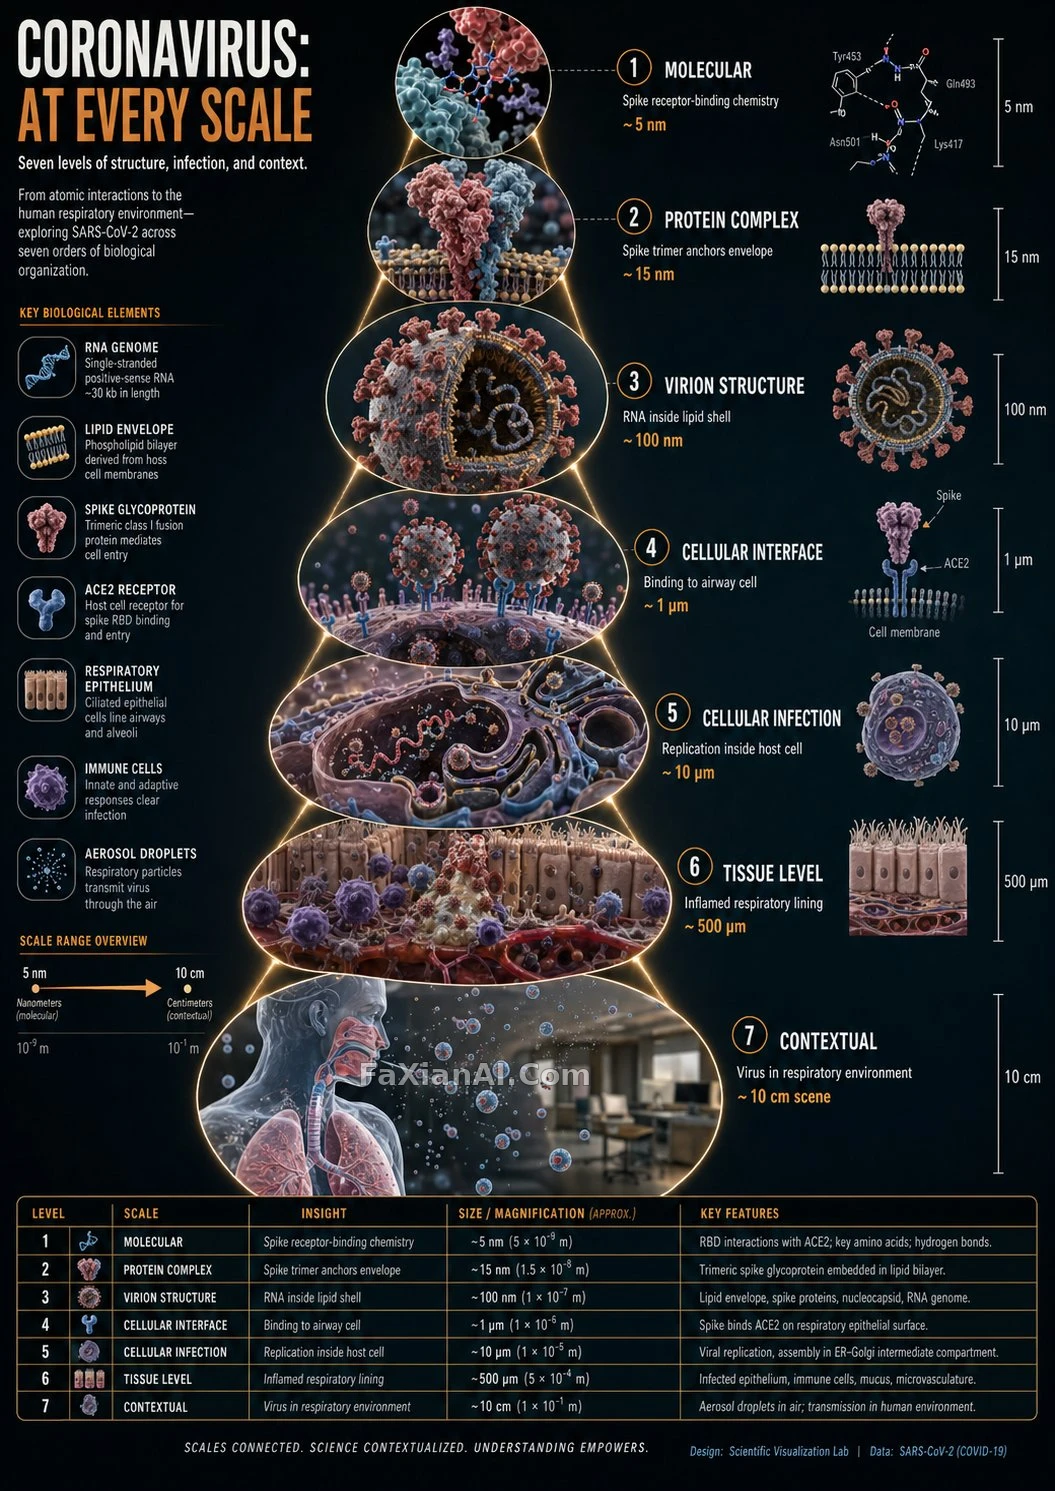
A Coronavirus Scale-Zoom Infographic, Level by Level
Six to eight circular frames magnify from the inside out, each panel showing only a new scale level.
Prompt notes
✍️ There's only one variable, [SUBJECT]; everything else is a layout constraint: 6-8 frames, no repeated scales, labels of 3-5 words. It's roughly an infographic written as a function, call it directly with a new subject.
Full prompt
📋 Prompt Natural Language1515 characters
<instructions>
[SUBJECT] = Coronavirus (any other subject can replace it).
Brief: turn that one input into a hyper-realistic zoom-sequence infographic made of 3D renders. You decide how many scale layers the subject has, starting at the atomic or component level and ending at its complete setting.
Frames, which are essential: no fewer than six and no more than eight, each one round or hexagonal, spreading outward step by step. The smallest visible detail lives in the innermost frame, while the outermost shows the entire subject within its surroundings. Faint zoom-path lines tie the frames together. A scale may appear only once: every frame uncovers something the previous one did not.
Inside every frame: a very detailed 3D render at that scale, a micro label (the scale's name such as "molecular," "cellular" or "structural," plus an insight of 3 to 5 words), and, if you like, a measurement tag or magnification factor.
Surrounding halo: reference only things tied to the scale, namely measurement units, scientific notation and cultural scale metaphors; skip generic magnifying-glass icons.
Alternative scale-panel layout lists: zoom level; key insight (3-5 words); scale factor tag; detail icon (grid, wave, particle, etc.).
Title: "[SUBJECT]: AT EVERY SCALE" or "ZOOM: THE WORLD OF [SUBJECT]".
Visual style: ultra-realistic 3D rendering in a scientific editorial infographic format, with precise macro lighting, global illumination, shallow depth of field and a clean sequential layout.
</instructions>
Related Cases
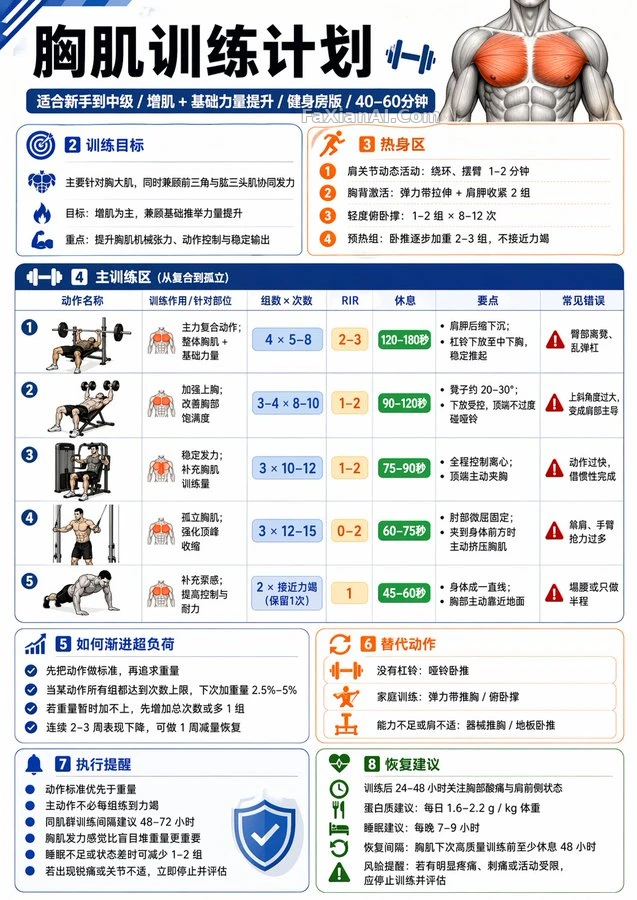 A Fitness Infographic That Builds a Plan From Your Training Topic
 Ten Slides, No Layout Repeats Twice
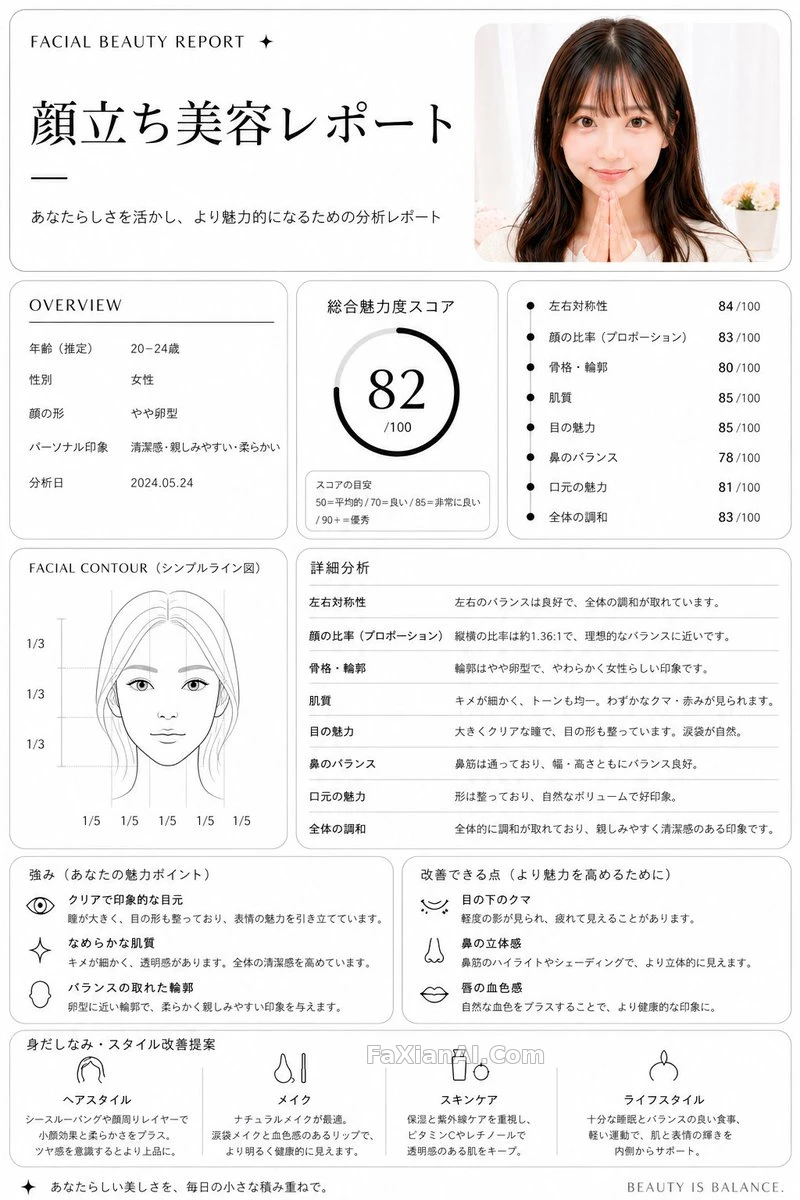 Breaking a Face Down Into a Checkup Report
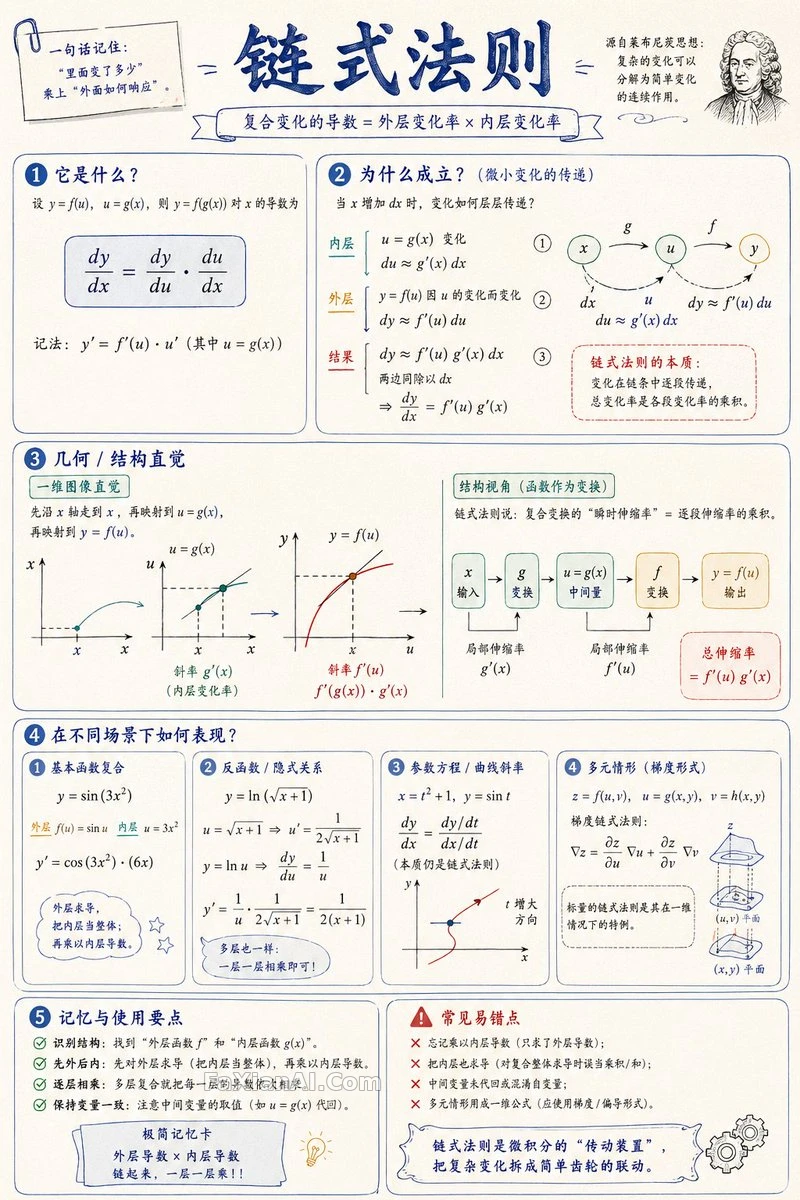 Hand-Drawn Math Handout, One Page, One Concept
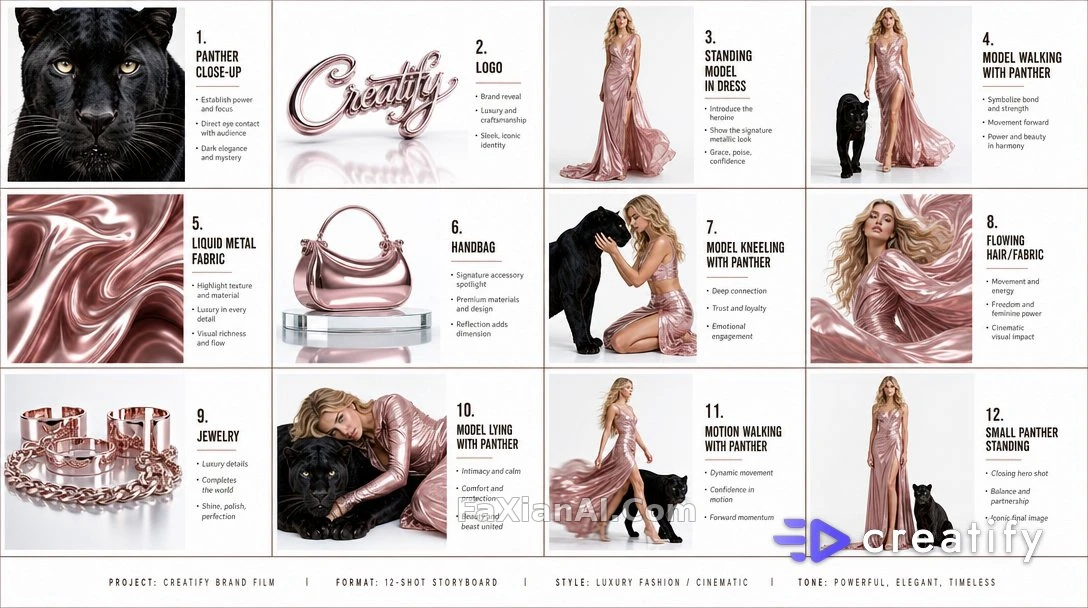 Twelve Storyboard Panels, Sorted Into a 4x3 Grid
 School Drama Relationship Chart, Pink Arrows Linking the Class
More GPT Image 2 cases
All GPT Image 2 cases → Lanting Preface Calligraphy Over a Misty Landscape Mask
 A Three-Teachings Egg-Shaped Manuscript Infographic
 A Valkyrie Sweeping a Segmented Whip-Sword Across a Ruined Battlefield
 Perfume in Five Stages, From Raw Material to Sculpture
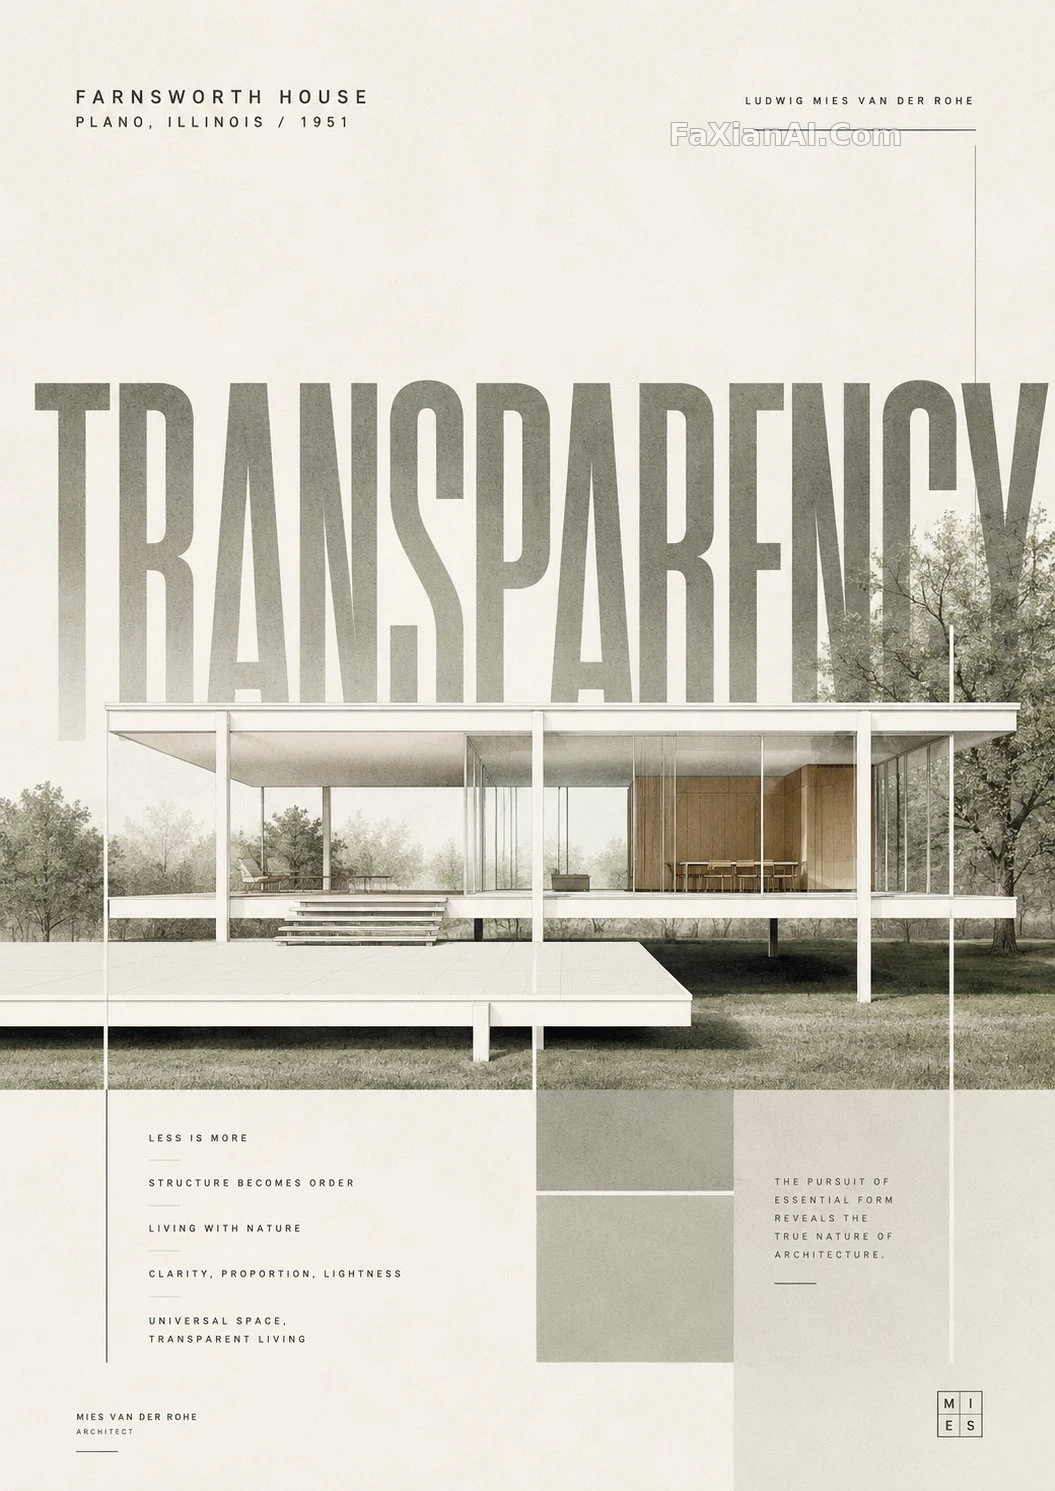 Giant-Word Layout for a Minimalist Landmark Poster
 Strawberry Energy Drink Can Bursting Into a Midair Ad
Related guides
Food and Drink Ad Poster Prompts: Lay Out Product, Selling Points and Price as Three Text Layers So the Model Stops CrammingThermos, Linen, and a Cold Drink — Light That Reveals MaterialsHow to Set Prompt Weights: The Real Effect of Bracket Syntax and Word Order